July 25, 2025
Which BI Tool Is Right for You? A Friendly Comparison to Help You Decide
July 10, 2025
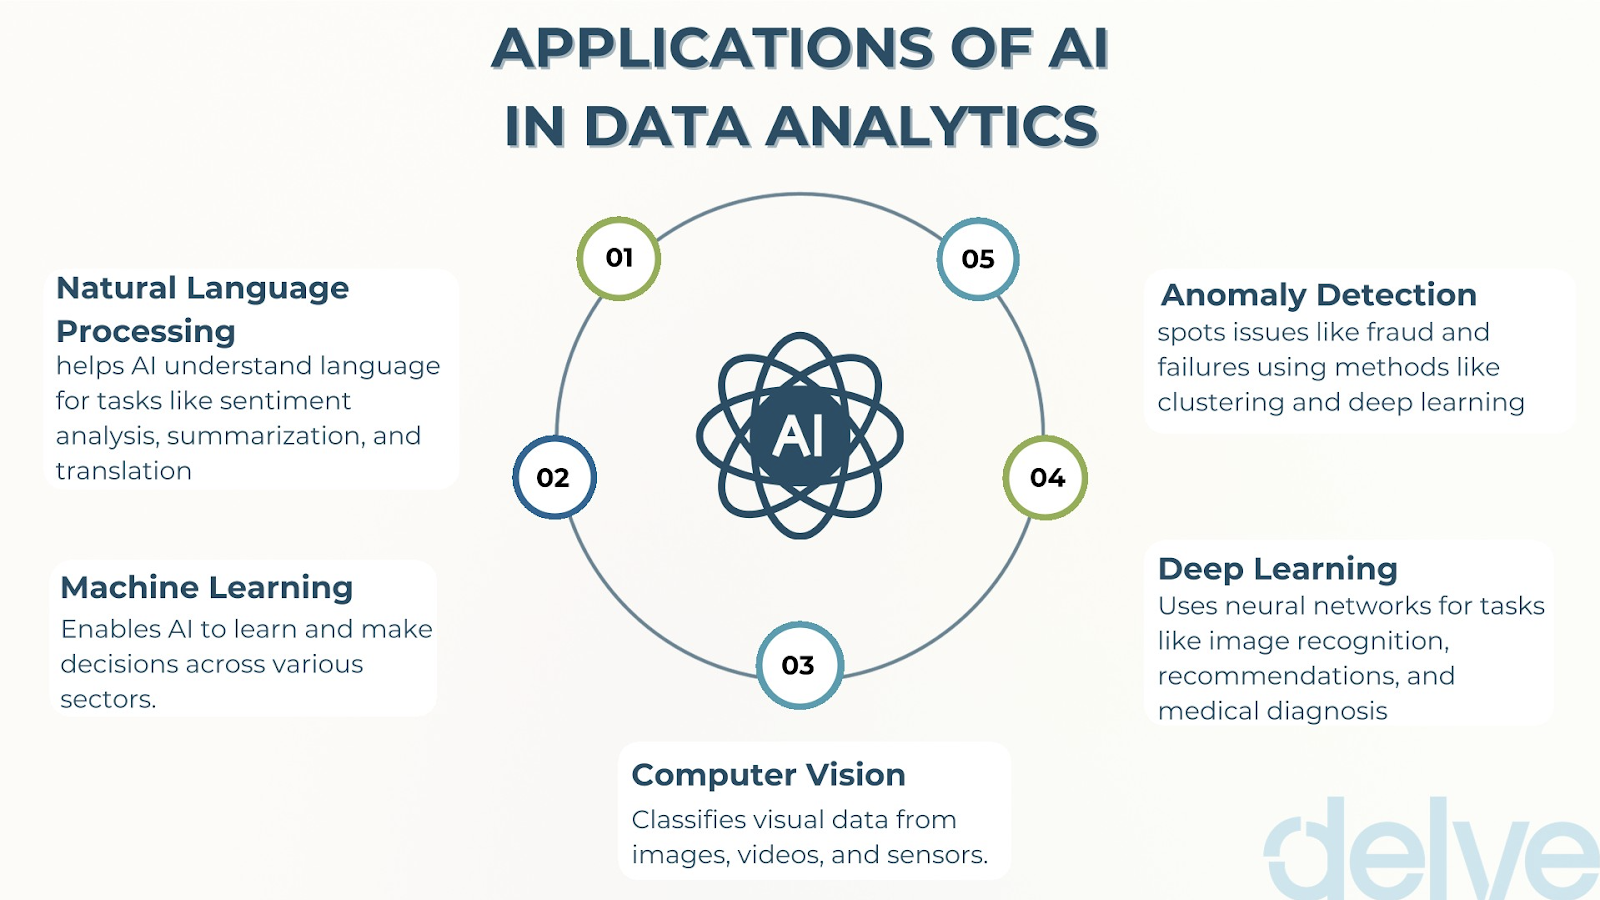
Let’s face it—data is everywhere, but making sense of it? That’s where a solid Business Intelligence (BI) tool comes in.
Whether you’re a small business just getting started or a large enterprise trying to scale insights across teams, choosing the right BI platform is a big decision.
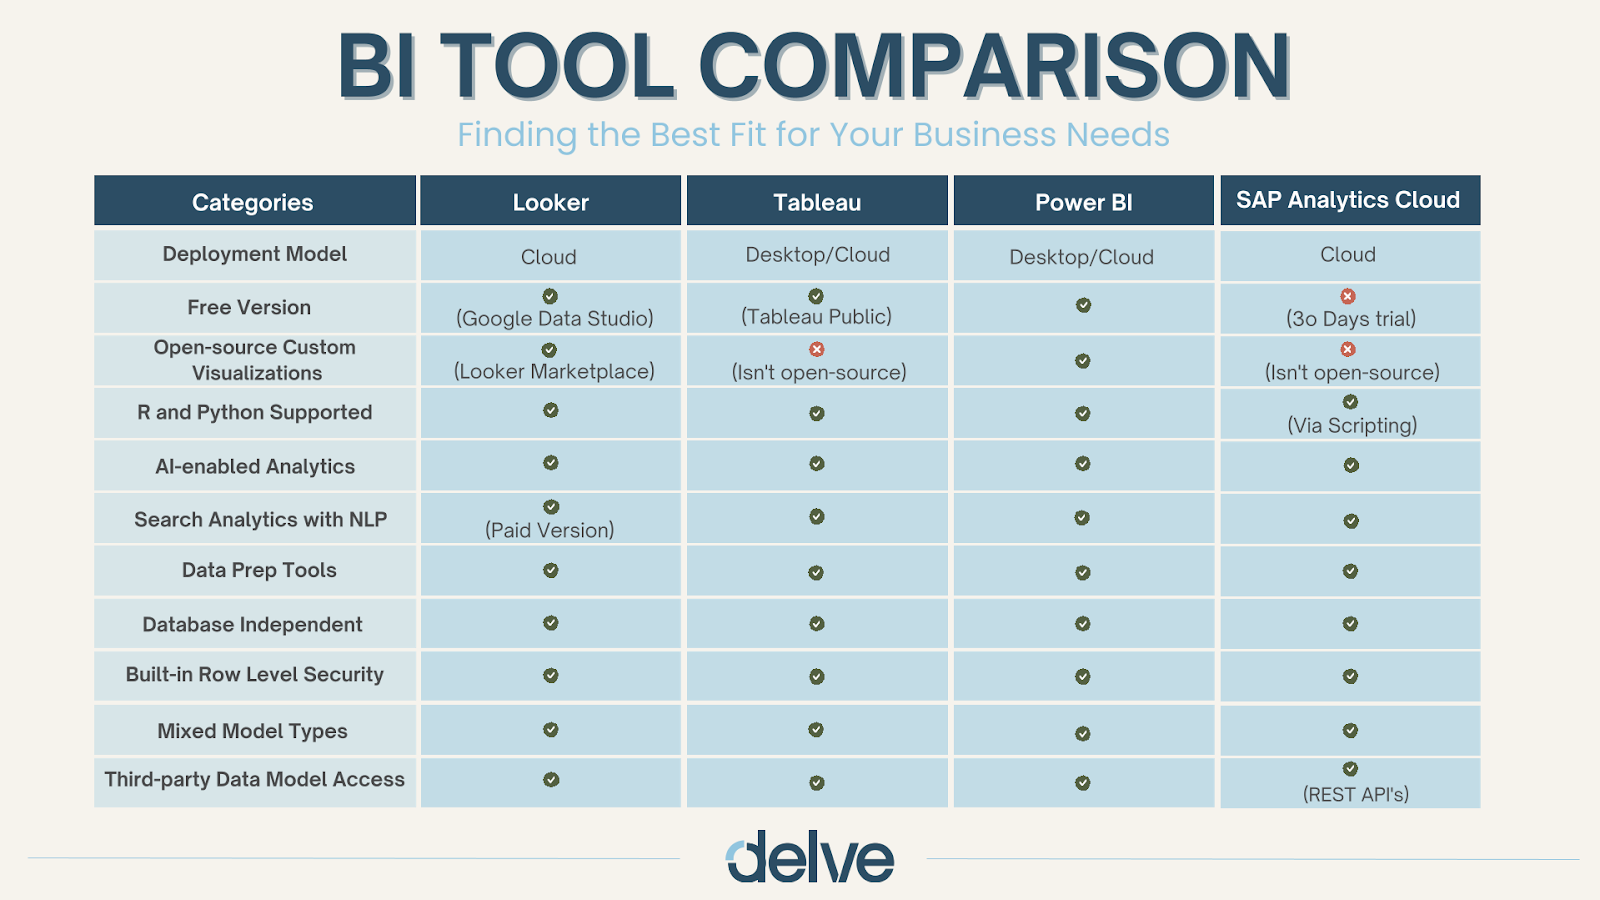
So, let’s break down four of the most popular BI tools out there - Looker, Tableau, Power BI, and SAP Analytics Cloud, and see how they stack up.
If your company is already invested in Google Cloud, Looker is probably your best friend.
Why you’ll love it:
Looker feels especially powerful for teams that work with structured datasets and want a governed, consistent approach to analytics.
When people talk about beautiful, interactive dashboards, they’re usually talking about Tableau.
Why it stands out:
If you’re less worried about deep back-end modeling and more focused on exploratory analysis and storytelling, Tableau could be your go-to.
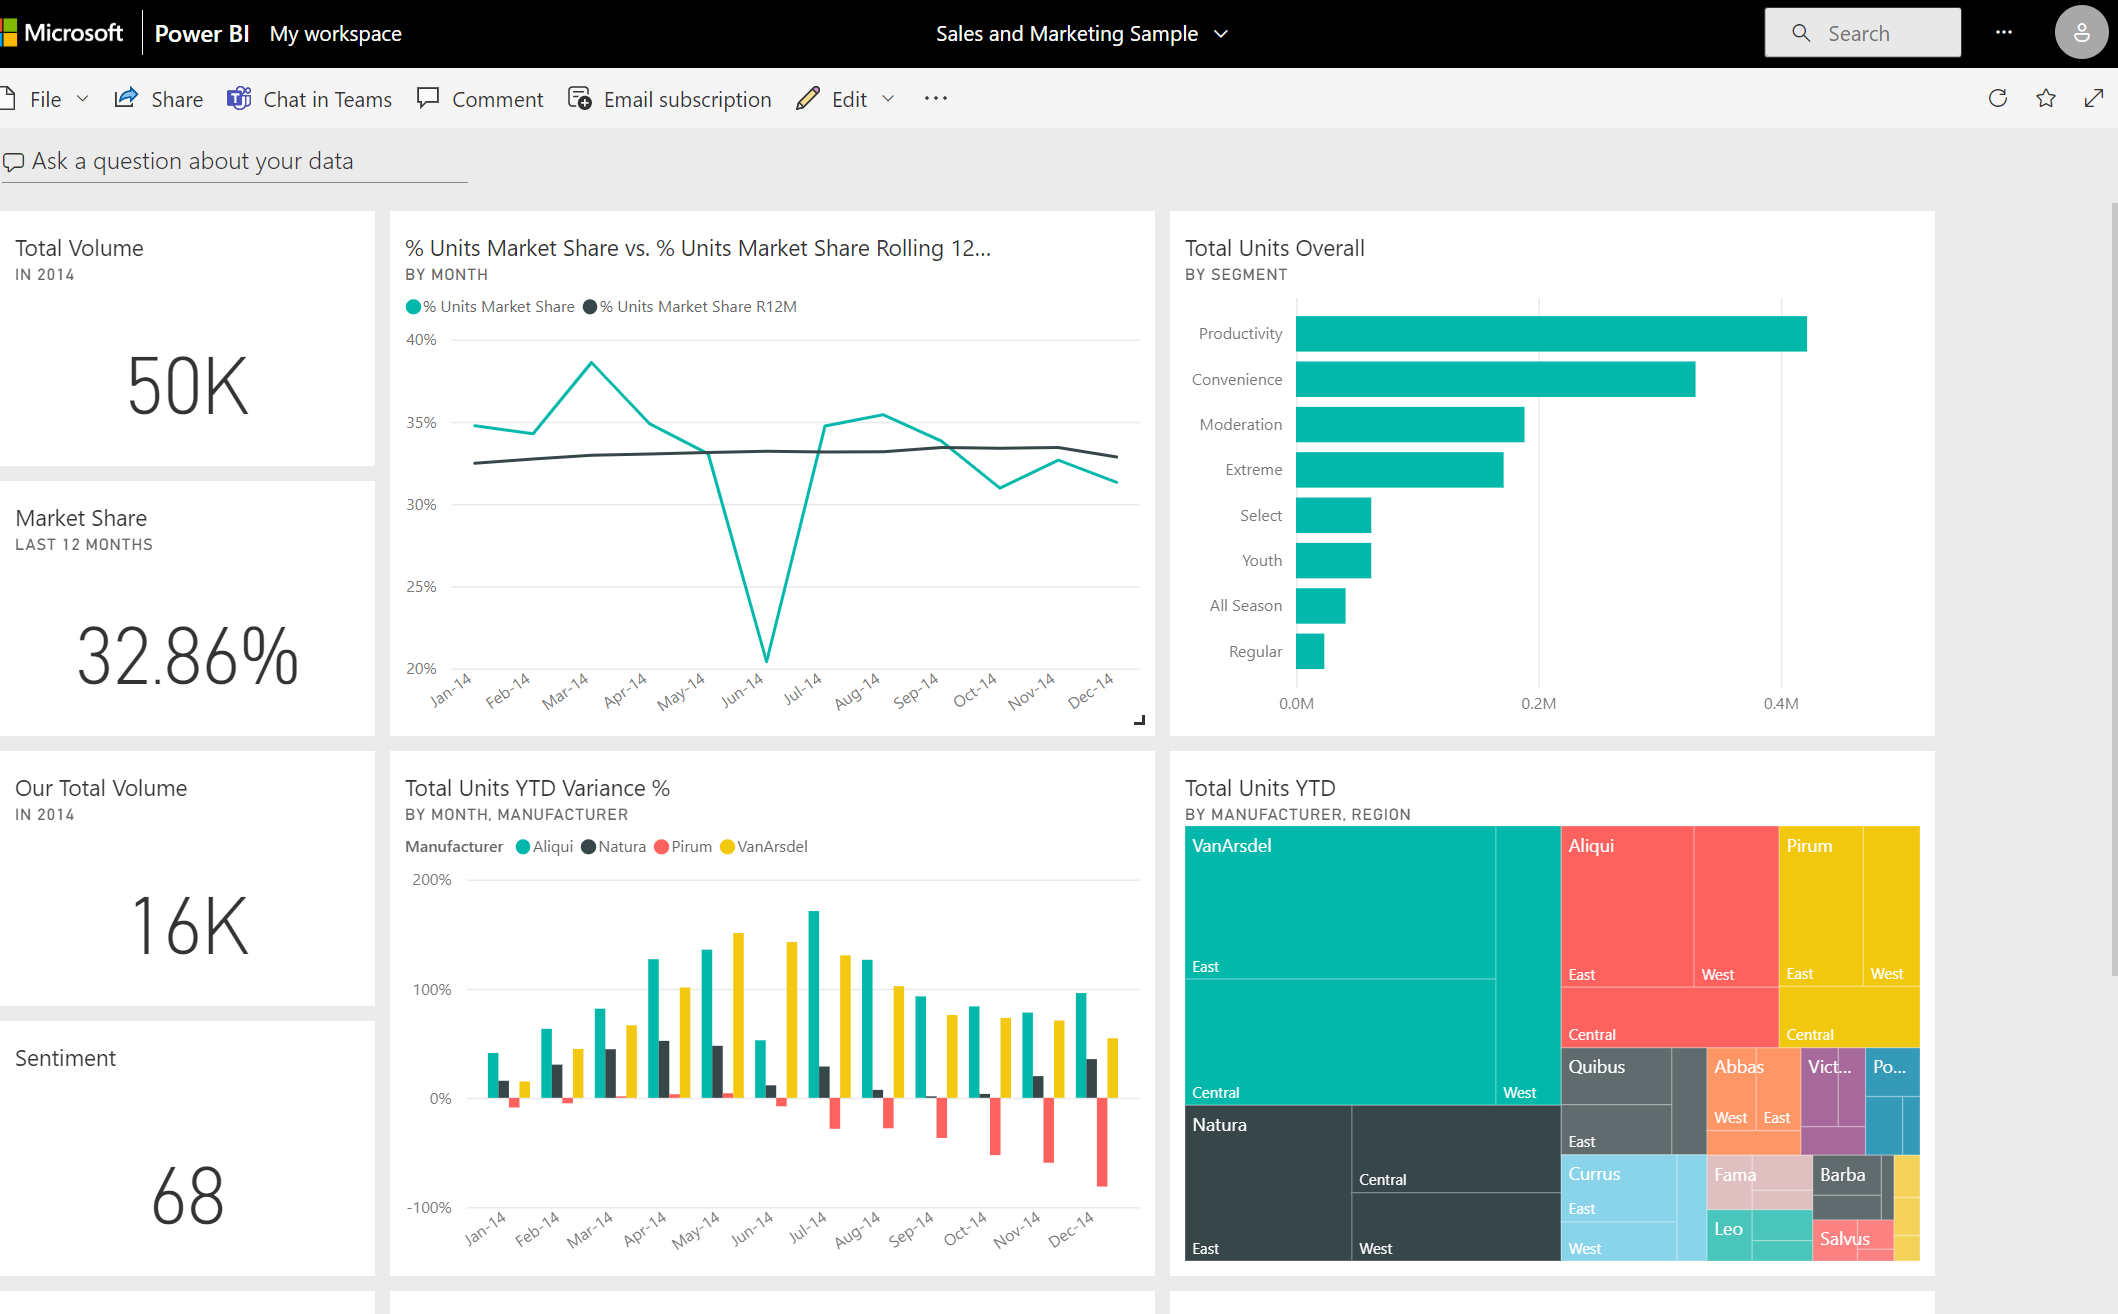
If you're already living in the Microsoft world (hello, Excel and Teams), Power BI makes a ton of sense.
Here’s why:
Power BI is perfect for teams that want to get started quickly, don’t want to break the bank, and love the Microsoft ecosystem.
If you’re in a large enterprise using SAP systems, this is your tool.
What makes it different:
If your business lives and breathes SAP, this tool will feel like home.
Looker: Google Cloud users, strong data modeling, custom dashboards
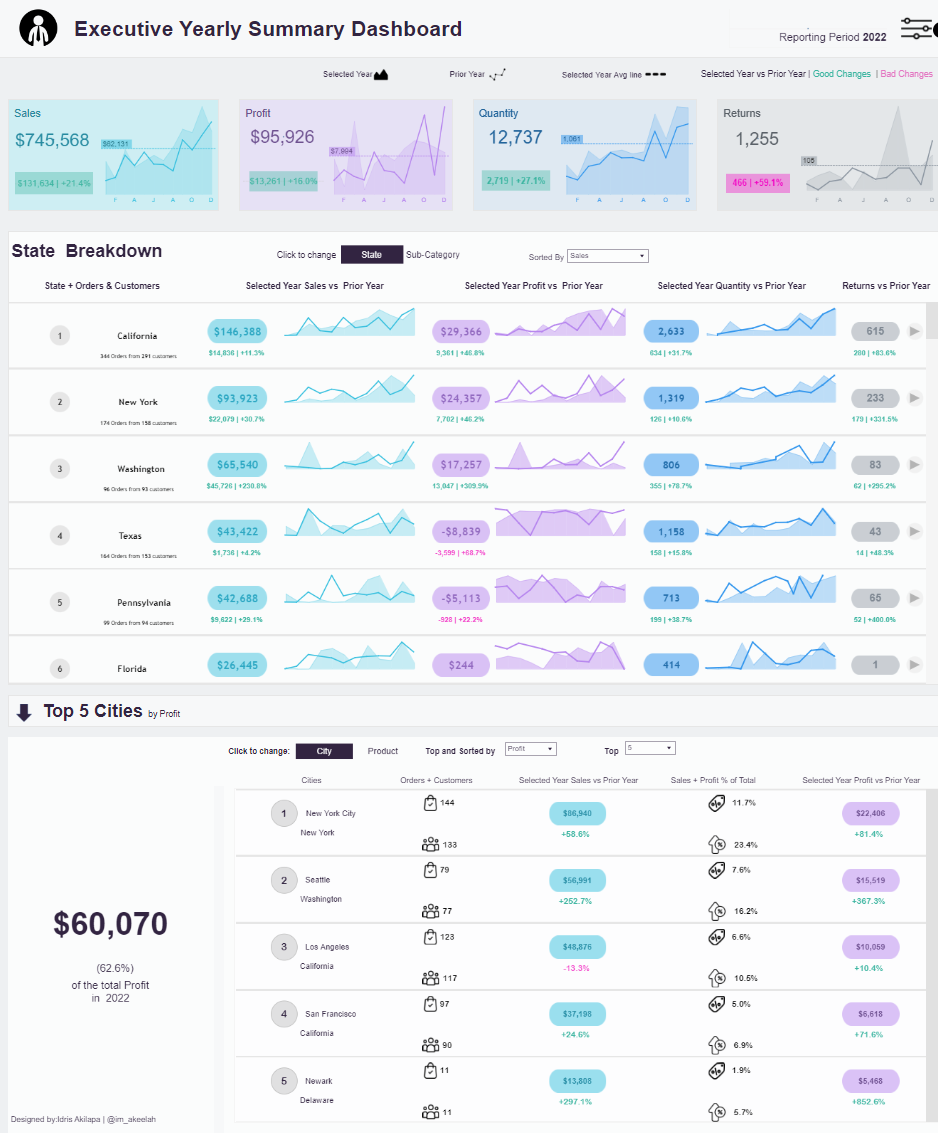
Tableau: Data visualizations & interactive dashboards
Power BI: Microsoft users, affordability, NLP features
SAP Analytics Cloud: Large enterprises with SAP ecosystems
At the end of the day, the “best” BI tool depends on:
There’s no wrong answer, just the right fit for your business.
Your on-demand analytics team